
tSNE Viewer
STUDENT DESIGNERS: Nicholas Weir & Rawnok Rayeka
PURPOSE: Multidimensional data sets are difficult to visualize and analyze. Visualization has proved to be a challenge in the analysis of mass cytometry data. Mass cytometry affords measurement of as many as 37 specific proteins in a single cell. However, analysis of this data is complicated by limitations in visualizing more than three dimensions at once. Mass cytometry is used to characterize cells and diagnose diseases. After cytometry data is obtained from tissue samples, the analysis of many parameters is required to characterize each cell. t-Distributed Stochastic Neighbor Embedding (t-SNE) is a robust multidimensional scaling algorithm for mapping higher-order datasets to lower-order dimensions. viSNE extends t-SNE to map high-dimensional cytometry data onto two dimensions while preserving the local geometry of the data. Analysis of 2-D or 3-D viSNE can be done in Matlab using cyt, a visualization tool. Interactivity and visualization of data in Matlab is limited. Consequently, we sought to build a bridge between Matlab and a popular game development engine, Unity3d (San Francisco, CA). Our software, tSNE Viewer, provides useful features for the analysis of high-order data sets. Data are imported into Matlab using a script (fcs2unity.m) that conducts t-SNE and prepares data for import to Unity3d. Unlike cyt, tSNE Viewer provides real-time interactivity with data including fast axial rotation, cell type labeling, and returning expression values for individual cells using a mouse hover function. We are preparing this tool to accept any high-order data set, and we anticipate enhanced visualization will lead to improved data analysis.
METHODS: Raw data (.fcs files) were procured from the Computational Systems Biology Laboratory at Columbia University (developers of cyt and viSNE). Raw data were transformed to remove outliers and sub-sampled to limit the data set to a representative 10,000 cells in viSNE/cyt. The data were imported into Matlab using fcs2unity, projected to 3-D, and exported as text. A list of marker labels and channels were created in a spreadsheet and loaded into Unity3d as a text file. Marker labels were procured from their respective manufacturer (BioLegend, San Diego; BD Biosciences, San Jose). Markers found on specific cell types were arranged to indicate their presence or absence using Bioscience CD_markers handbook along with BioLegend website. 10,000 individual cells were plotted in 3-D space according to the output of t-SNE by fcs2unity. Individual cells were colored according to the intensity of expression for a selected channel/marker. Standard user interface commands were mapped to the Unity3d input scheme, allowing users to rotate data, select individual data points, hover over data points to retrieve expression values, select different data bases and channels, and determine whether this channel was a reliable indicator for the presence or absence of a specific cell type.
RESULTS: tSNE Viewer is an improvement compared to cyt for the visualization of high-order data. tSNE Viewer allows for rapid classification of cell types by cytometry data, where the presence or absence of a number of characteristic markers/channels identifies the cell. The axial rotation improves upon the 3-D rotation feature in cyt. The 3D rotation feature made it difficult to effectively rotate the three-dimensional viSNE map with precision. Additionally, cyt in Matlab projects data using an orthogonal projection, which flattens the data and makes it difficult to distinguish cells in the distance from cells closer to the viewer. By using the advanced visualization tools in Unity3d, tSNE Viewer accurately projects the data onto 3D space with perspective, making it easy to distinguish cells in depth. The expression value augments the expression color bar feature in cyt. The expression value for each individual cell can be determined by simply moving the mouse cursor over the specific cell.
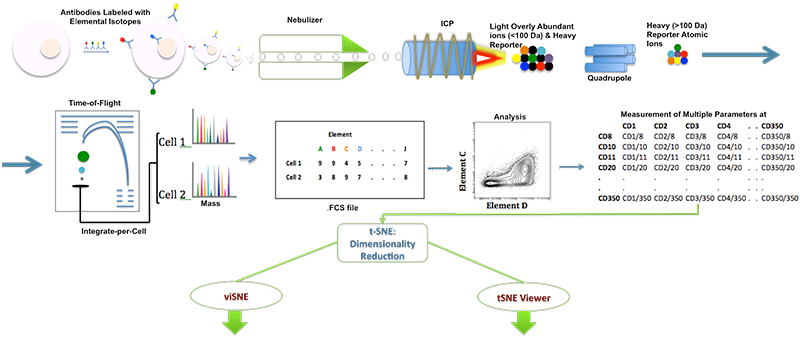
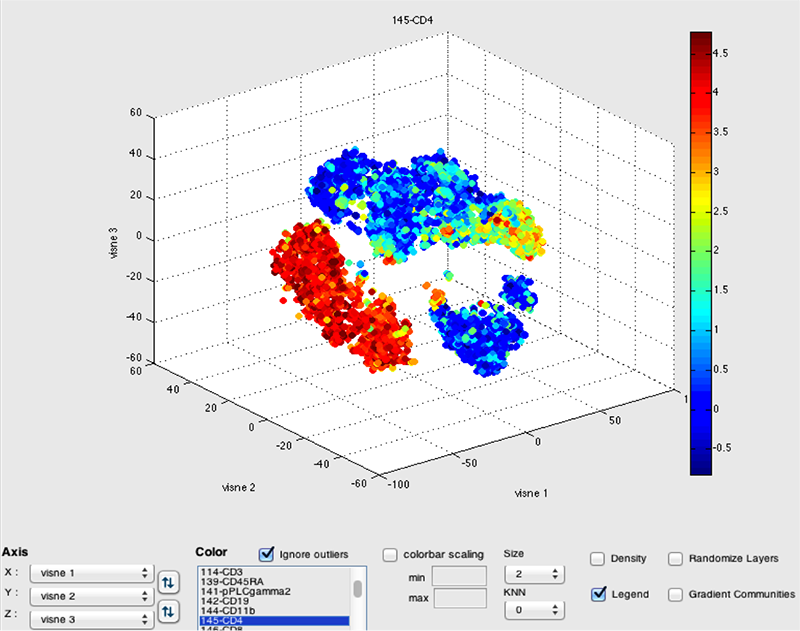
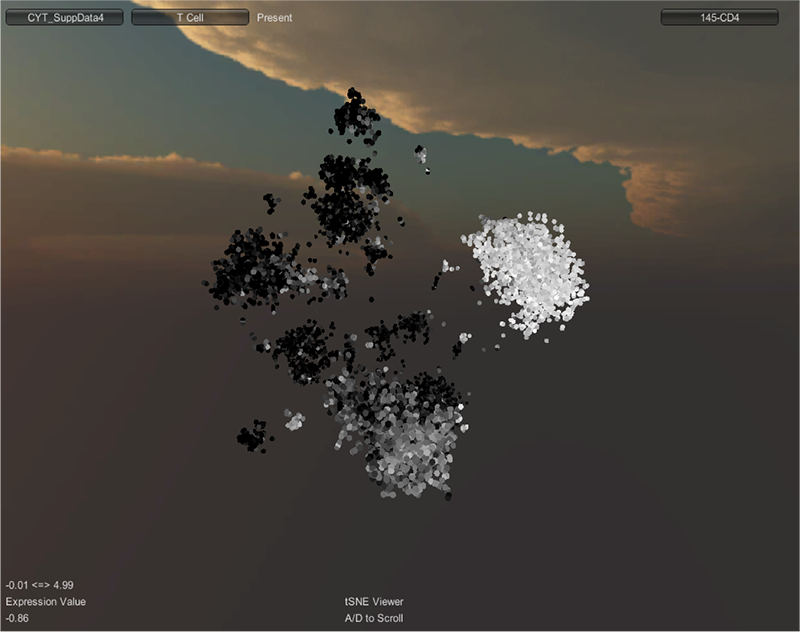
DISCUSSION: A schematic of inductively coupled plasma mass spectrometry (ICP-MS) for cell markers is shown in Figure 1. Figures 2 and 3 depict multidimensionally scaled data in cyt and tSNE Viewer, which was generated from cancer cells. Data are both labeled using the same surface marker (CD4). The visual perspective effect can be observed in the tSNE Viewer and not in cyt. tSNE Viewer capitalizes on the standard features of a game development engine to visualize higher-order data sets in 3-D with ease and precision. We anticipate that this improved user interface will allow investigators to navigate complicated data sets better and lead to a better understanding of data. More features will be added to tSNE Viewer to facilitate analysis of high-order data sets. The software will be published and made available to the public. A generic version of the software will be created to import and visualize generic higher-order data sets.
REFERENCES
- van der Maaten, L.J.P. and Hinton, G.E. (2008). Visualizing Data using t-SNE. Journal of Machine Learning Research, 9(Nov):2579–2605.
- Amir E.D, Davis K.L., Tadmor M.D., Simonds E.F., Levine J.H., Bendall S.C., Shenfeld D.K., Krishnaswamy S., Nolan G.P., Pe'er D. (2013). viSNE enables visualization of high dimensional single-cell data and reveals phenotypic heterogeneity of leukemia. Nature Biotech. 31(6): 545-554.
ACKNOWLEDGEMENTS: Funded in part by the Department of Education. We thank Dr. Dana Pe'er and Michelle Tadmor at Columbia University for sharing the raw data, viSNE, and cyt.
STUDENT DESIGNERS: Nicholas Weir & Rawnok Rayeka
PURPOSE: Multidimensional data sets are difficult to visualize and analyze. Visualization has proved to be a challenge in the analysis of mass cytometry data. Mass cytometry affords measurement of as many as 37 specific proteins in a single cell. However, analysis of this data is complicated by limitations in visualizing more than three dimensions at once. Mass cytometry is used to characterize cells and diagnose diseases. After cytometry data is obtained from tissue samples, the analysis of many parameters is required to characterize each cell. t-Distributed Stochastic Neighbor Embedding (t-SNE) is a robust multidimensional scaling algorithm for mapping higher-order datasets to lower-order dimensions. viSNE extends t-SNE to map high-dimensional cytometry data onto two dimensions while preserving the local geometry of the data. Analysis of 2-D or 3-D viSNE can be done in Matlab using cyt, a visualization tool. Interactivity and visualization of data in Matlab is limited. Consequently, we sought to build a bridge between Matlab and a popular game development engine, Unity3d (San Francisco, CA). Our software, tSNE Viewer, provides useful features for the analysis of high-order data sets. Data are imported into Matlab using a script (fcs2unity.m) that conducts t-SNE and prepares data for import to Unity3d. Unlike cyt, tSNE Viewer provides real-time interactivity with data including fast axial rotation, cell type labeling, and returning expression values for individual cells using a mouse hover function. We are preparing this tool to accept any high-order data set, and we anticipate enhanced visualization will lead to improved data analysis.
METHODS: Raw data (.fcs files) were procured from the Computational Systems Biology Laboratory at Columbia University (developers of cyt and viSNE). Raw data were transformed to remove outliers and sub-sampled to limit the data set to a representative 10,000 cells in viSNE/cyt. The data were imported into Matlab using fcs2unity, projected to 3-D, and exported as text. A list of marker labels and channels were created in a spreadsheet and loaded into Unity3d as a text file. Marker labels were procured from their respective manufacturer (BioLegend, San Diego; BD Biosciences, San Jose). Markers found on specific cell types were arranged to indicate their presence or absence using Bioscience CD_markers handbook along with BioLegend website. 10,000 individual cells were plotted in 3-D space according to the output of t-SNE by fcs2unity. Individual cells were colored according to the intensity of expression for a selected channel/marker. Standard user interface commands were mapped to the Unity3d input scheme, allowing users to rotate data, select individual data points, hover over data points to retrieve expression values, select different data bases and channels, and determine whether this channel was a reliable indicator for the presence or absence of a specific cell type.
RESULTS: tSNE Viewer is an improvement compared to cyt for the visualization of high-order data. tSNE Viewer allows for rapid classification of cell types by cytometry data, where the presence or absence of a number of characteristic markers/channels identifies the cell. The axial rotation improves upon the 3-D rotation feature in cyt. The 3D rotation feature made it difficult to effectively rotate the three-dimensional viSNE map with precision. Additionally, cyt in Matlab projects data using an orthogonal projection, which flattens the data and makes it difficult to distinguish cells in the distance from cells closer to the viewer. By using the advanced visualization tools in Unity3d, tSNE Viewer accurately projects the data onto 3D space with perspective, making it easy to distinguish cells in depth. The expression value augments the expression color bar feature in cyt. The expression value for each individual cell can be determined by simply moving the mouse cursor over the specific cell.
DISCUSSION: A schematic of inductively coupled plasma mass spectrometry (ICP-MS) for cell markers is shown in Figure 1. Figures 2 and 3 depict multidimensionally scaled data in cyt and tSNE Viewer, which was generated from cancer cells. Data are both labeled using the same surface marker (CD4). The visual perspective effect can be observed in the tSNE Viewer and not in cyt. tSNE Viewer capitalizes on the standard features of a game development engine to visualize higher-order data sets in 3-D with ease and precision. We anticipate that this improved user interface will allow investigators to navigate complicated data sets better and lead to a better understanding of data. More features will be added to tSNE Viewer to facilitate analysis of high-order data sets. The software will be published and made available to the public. A generic version of the software will be created to import and visualize generic higher-order data sets.
REFERENCES
- van der Maaten, L.J.P. and Hinton, G.E. (2008). Visualizing Data using t-SNE. Journal of Machine Learning Research, 9(Nov):2579–2605.
- Amir E.D, Davis K.L., Tadmor M.D., Simonds E.F., Levine J.H., Bendall S.C., Shenfeld D.K., Krishnaswamy S., Nolan G.P., Pe'er D. (2013). viSNE enables visualization of high dimensional single-cell data and reveals phenotypic heterogeneity of leukemia. Nature Biotech. 31(6): 545-554.
ACKNOWLEDGEMENTS: Funded in part by the Department of Education. We thank Dr. Dana Pe'er and Michelle Tadmor at Columbia University for sharing the raw data, viSNE, and cyt.